Title and closing software comes with a lot to explain. AtClose’s redesign gives platform details, integrations and business information different visual treatments, connected by a consistent blue-led language.
My role
Website visual design · Zamstars
Collaboration
Content-team copy and client-supplied product screenshots
Visit website ↗Design exports from implemented pages · Live copy, imagery and details may differ.
Selected screens / Visual design
A closer look at the work.
Select a screen to explore it at full size.
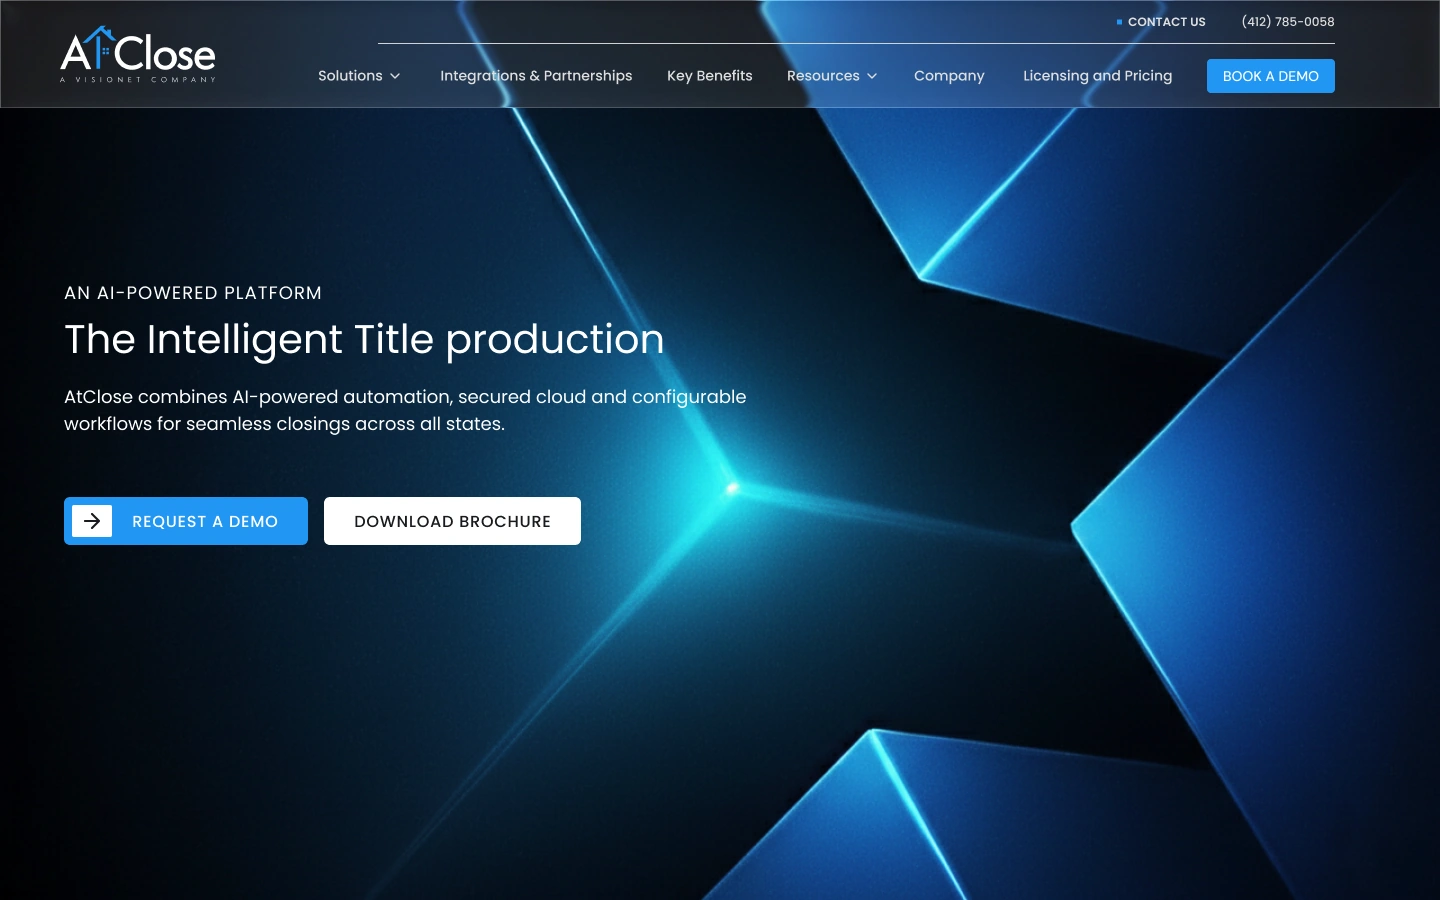
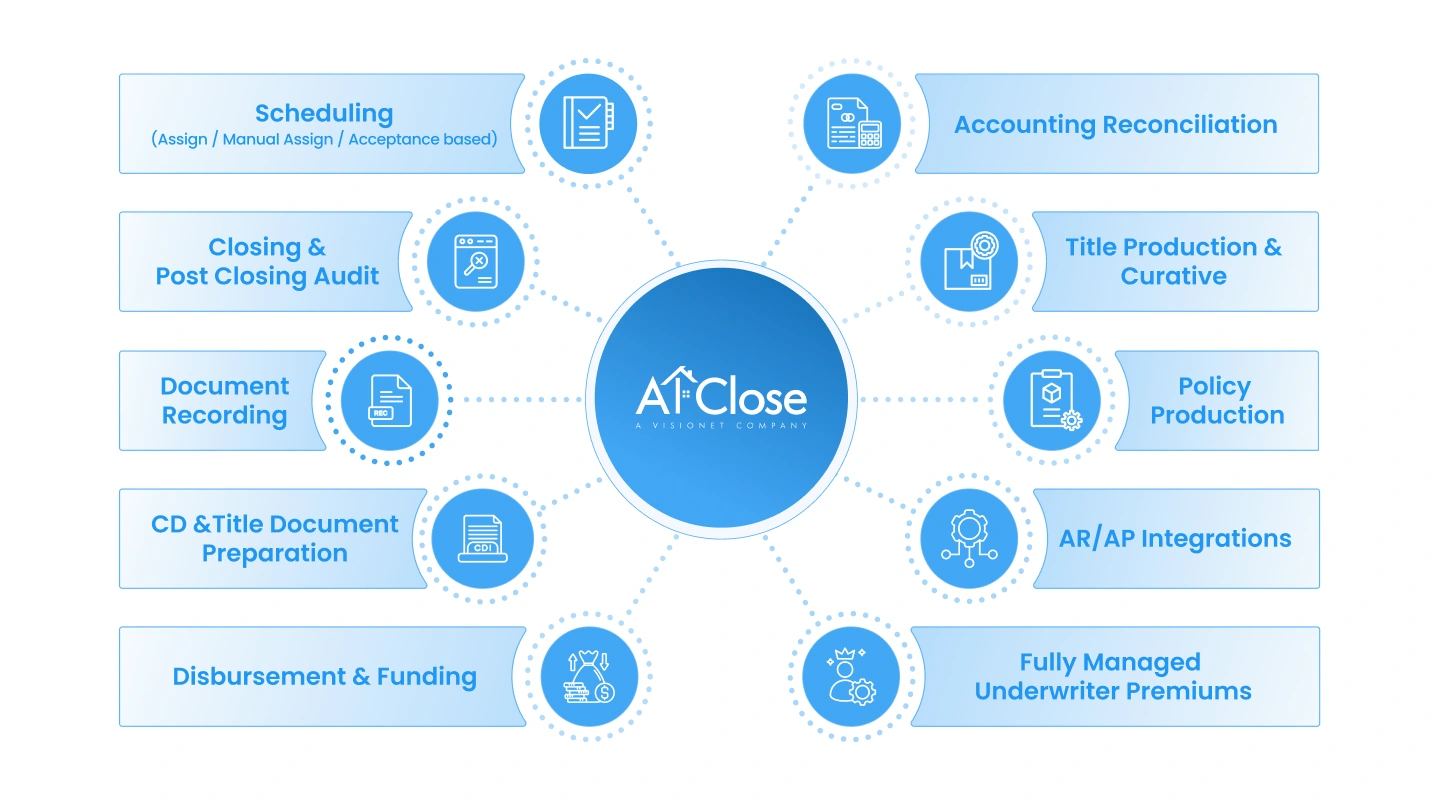
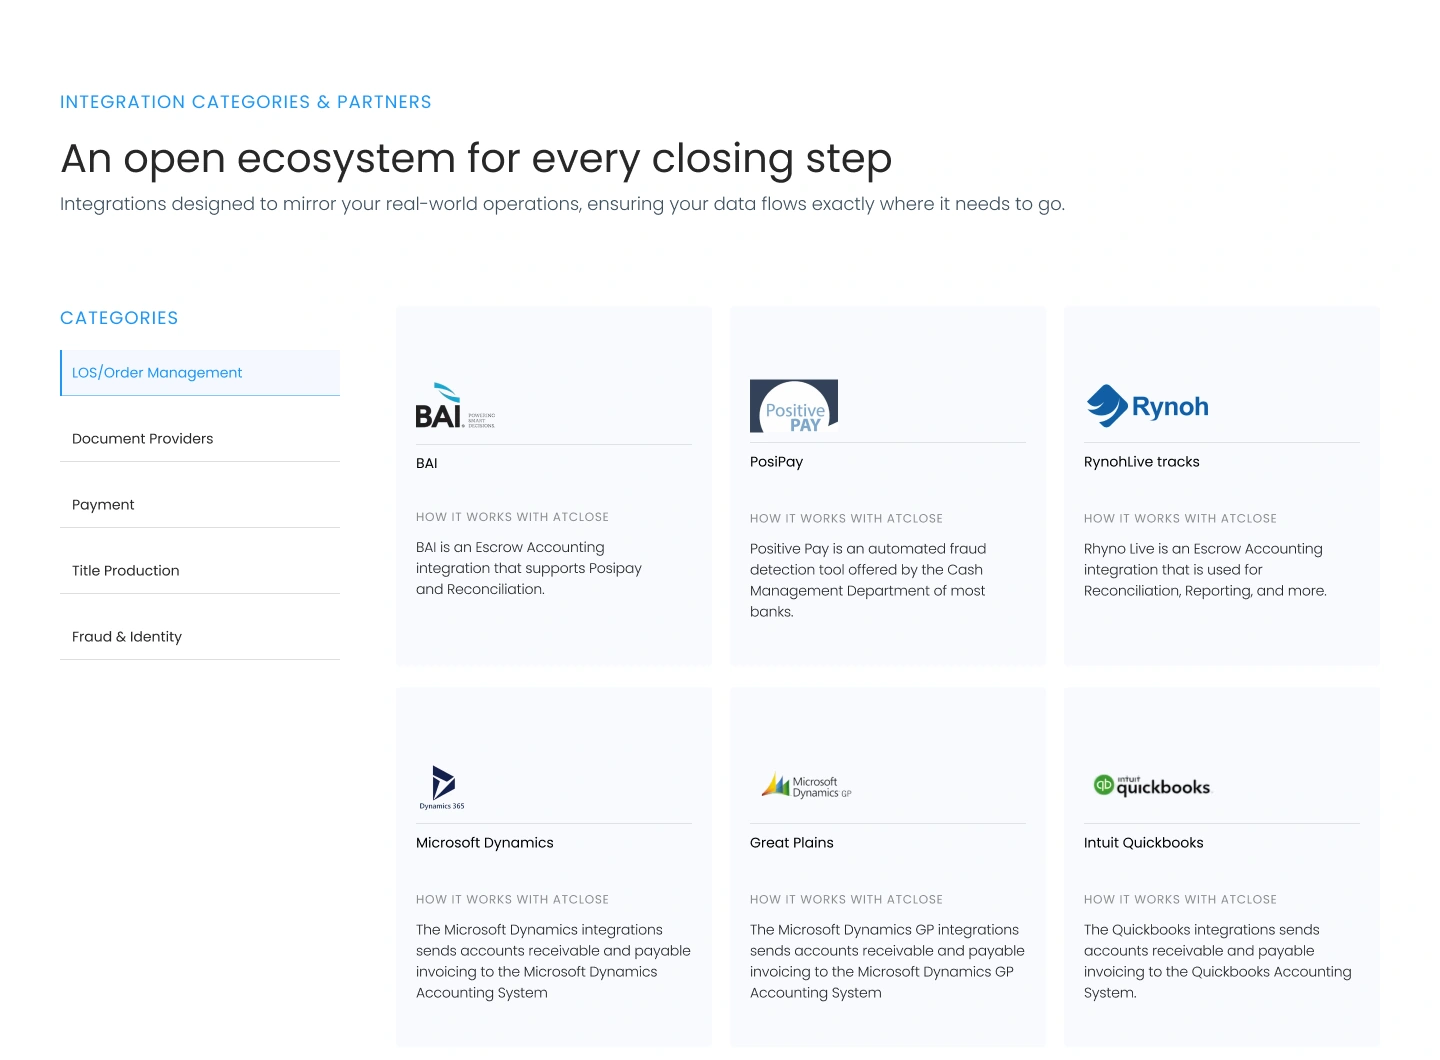
View full size ↗01A dark geometric opening separates the main message, supporting copy and actions.View full size ↗02The module diagram gives platform detail a distinct format within the website.View full size ↗03Category labels, a selected state and repeated partner cards structure the supplied integration information.View full size ↗04Photography and number cards change the page’s visual pace. Figures describe the client’s business.
Specialist information
Give the detail an order
AtClose speaks to settlement teams and lenders. The design work centred on presenting supplied copy and product screens through hierarchy and spacing, with enough variation to distinguish the different kinds of information.
A visual hierarchy
Change the pace as the story unfolds
A dark geometric opening introduces the platform. Lighter sections follow for the detail, while large headings, blue labels and a module diagram provide different points of entry into the explanation.
The module diagram gives platform detail a distinct format within the website.
Partner browsing
Keep partner browsing familiar
The integrations page uses category labels and repeated partner cards. A blue selected state marks the active category, while consistent spacing keeps the partner information in a predictable format.
Category labels, a selected state and repeated partner cards structure the supplied integration information.
A change of pace
Bring the business back to people
A pale-blue homepage grid pairs business figures with people and key-handover imagery. After the technology-led opening, it gives the service context its own visual presence and changes the page’s rhythm.
Photography and number cards change the page’s visual pace. Figures describe the client’s business.
In use
Carry the direction across the redesign
My website visual-design work at Zamstars covered approximately seven to eight pages, using content-team copy and client-supplied product screens. The live site reflects the design. Its figures describe the client’s business, rather than measured redesign results.